Loan Management Software Pricing: Non-Bank Lenders 100-500
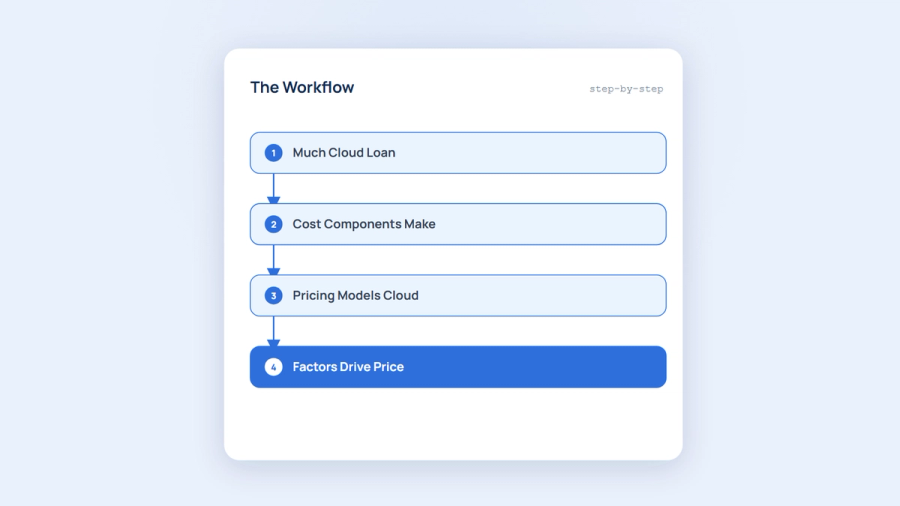
Table of Contents
TL;DR
- Cloud LMS for 100-500 loan portfolios ranges $400-$2,000/month; typical entry point is $1,200-$1,500/month for growing non-bank lenders.
- First-year costs include licensing ($4,800-$24,000/year), implementation ($2,000-$10,000), and infrastructure; recurring annual cost is 40-60% lower than year one.
- Pricing depends on user seats, loan volume, integrations, and customization, not feature count alone.
- Non-bank lenders with minimal integrations and standard workflows qualify for low-end pricing ($400-$800/month); mid-market setups with compliance and API integrations cost $1,500-$2,500/month.
- Per-loan-per-month models ($1-$5 per active loan) and tiered user-based pricing are the two dominant structures; hybrid models are rare.
- Implementation and data migration add 30-50% to first-year spend; support and maintenance add another 15-25% annually.
Cloud-based loan management systems for non-bank lenders managing 100-500 active loans typically cost between $400 and $2,000 per month ($4,800-$24,000 annually) in SaaS subscription fees, plus $2,000-$10,000 in first-year implementation and setup. Pricing is determined by user count, per-loan volume, integration scope, and compliance reporting requirements.
Entry-level platforms for basic workflows start at $400-$800/month; mid-market platforms with compliance features and standard integrations range $1,200-$1,500/month; higher-complexity setups with custom integrations and advanced reporting exceed $2,000/month.
A cloud-based loan management system (LMS) for non-bank lenders managing 100-500 active loans is a SaaS platform that automates loan servicing, payment tracking, borrower communication, and compliance reporting. Most vendors charge either per-user tiered ($200-$500 per user per month for 3-5 users) or per-active-loan scaled ($1-$5 per loan per month), with first-year implementation and setup costs adding $2,000 to $10,000.
Pricing reflects the scope of integrations, compliance features, and customization required.
How Much Does a Cloud Loan Management System Cost for Non-Bank Lenders?
The base monthly SaaS subscription for a non-bank lender managing 100-500 loans ranges from $400 to $2,000. Entry-level platforms that handle basic loan servicing, payment tracking, and borrower communication without deep compliance or integration features start at $400-$800/month. Mid-market platforms with compliance reporting modules, standard API integrations (accounting, CRM, payment processors), and white-label borrower portals typically cost $1,200-$1,500/month.
High-feature setups that include custom integrations, advanced reporting dashboards, and multi-entity support exceed $2,000/month.
In practice, most growing non-bank lenders land in the $1,200-$1,500/month range because they need compliance reporting and at least two API integrations. Lenders with 100-200 active loans and minimal external systems can sometimes qualify for the $400-$800 tier, but that threshold is narrow. Lenders managing 200-500 loans with regulatory reporting requirements almost always need mid-market features and pricing.
Annual recurring SaaS costs therefore range $4,800-$24,000. A lender paying $1,200/month spends $14,400/year; a lender at $1,500/month spends $18,000/year. Entry-level platforms ($400/month) cost $4,800 annually; high-end platforms ($2,000/month) cost $24,000 annually. These figures exclude first-year implementation and setup, which add $2,000-$10,000, and annual maintenance and support fees, which typically add 15-25% of the annual licensing cost.
What Bryt Software Does for Growing Non-Bank Lenders
Bryt Software is a cloud-based loan management platform designed for growing lenders of all types, including private and commercial lenders, banks, CDFIs, and microfinance institutions. The platform automates loan servicing, payment tracking, borrower communication, and compliance reporting through an intuitive, white-labeled dashboard that requires no technical implementation.
Bryt charges a tiered per-user model starting at approximately $200-$300 per user per month for 3-5 users, placing it in the $600-$1,500/month range for typical non-bank lender setups with 100-500 loans.
Bryt includes standard integrations with accounting systems, payment processors, and CRM platforms at no additional module cost, and offers a 14-day free trial for new accounts. Implementation is self-service for standard workflows, which keeps first-year setup costs at the low end of the $2,000-$10,000 industry range.
The platform is particularly well-suited for lenders who need compliance reporting and white-label borrower portals but lack internal IT resources to manage on-premise infrastructure.
What Cost Components Make Up First-Year Spending for a Loan Management System?
First-year total cost of ownership for a cloud loan management system includes the base SaaS subscription, implementation and setup, data migration, training, and annual maintenance and support. These components together range $7,500-$45,000 in year one, with recurring costs dropping 40-60% in year two once implementation expenses roll off.
| Cost Component | Typical Range | Timing | Notes |
|---|---|---|---|
| Base SaaS subscription | $4,800-$24,000/year | Monthly | Entry-level $400/month; mid-market $1,200-$1,500/month; high-end $2,000/month |
| Implementation and setup | $2,000-$10,000 | One-time | Includes configuration, workflow mapping, and system testing; represents 20-30% of first-year spend |
| Data migration | $1,000-$5,000 | One-time | Often bundled in implementation; separate when importing from legacy systems or Excel |
| Training | $500-$2,000 | One-time | Online training often included; on-site or custom training sessions cost extra |
| Annual maintenance and support | 15-25% of annual license fee | Annual | $720-$6,000/year depending on license tier; covers software updates, bug fixes, and support tickets |
| Add-on modules | $500-$2,000/month | Monthly | Compliance reporting, API integrations, white-labeling; often priced separately from base subscription |
Implementation and data migration are the largest unknowns in first-year budgeting. A lender migrating 300 loans from Excel spreadsheets or a legacy DOS-based system typically spends $3,000-$7,000 on data cleanup, mapping, and import validation. A lender migrating from another cloud LMS with clean data exports spends $1,000-$2,000.
The difference reflects the labor required to normalize loan records, payment histories, and borrower contact information into the new system’s schema.
Teams consistently underestimate the time required to map legacy workflows onto a new platform. Implementation includes configuring loan products, payment schedules, interest accrual methods, and reporting templates. A mid-market setup with two loan products and three user roles typically requires 20-40 hours of configuration work, which vendors price at $2,000-$4,000. High-complexity setups with custom workflows, multi-entity structures, or non-standard accrual methods can exceed $10,000.
Annual maintenance and support fees run 15-25% of the annual licensing cost and cover software updates, bug fixes, and support tickets. A lender paying $14,400/year in SaaS fees spends an additional $2,160-$3,600/year in support fees. Many vendors bundle basic support into the base subscription and charge separately for premium support tiers with faster response times or dedicated account management.
What Pricing Models Do Cloud Loan Management Systems Use?
Cloud loan management systems use two dominant pricing models: per-loan-per-month ($1-$5 per active loan per month) and per-user-per-month tiered ($200-$500 per user per month). Per-loan pricing scales with portfolio size and is common among platforms targeting private lenders and CDFIs. Per-user pricing scales with team size and is common among platforms targeting banks and commercial lenders with larger internal operations teams.
Hybrid models that combine a base platform fee with per-loan or per-user add-ons are emerging but remain rare.
Per-Loan-per-Month Pricing
Per-loan pricing charges $1-$5 per active loan per month, with the per-loan rate decreasing as portfolio size grows. A lender with 100 active loans paying $3 per loan per month spends $300/month ($3,600/year). A lender with 300 active loans at $2.50 per loan per month spends $750/month ($9,000/year). A lender with 500 active loans at $2 per loan per month spends $1,000/month ($12,000/year).
Per-active-loan cost decreases with portfolio growth: $72/loan/year at 100 loans; $54/loan/year at 300 loans; $36/loan/year at 500 loans. This model rewards portfolio growth and is well-suited for lenders who expect to add loans steadily over time. The primary risk is mid-year pricing surprises.
Most vendors tier their per-loan rates by volume, so a lender crossing from 250 to 300 loans may trigger a higher rate tier and see monthly costs jump $200-$400.
Vendors define “active loan” differently. Some count only loans with outstanding principal balances. Others count any loan not marked paid-off or written-off, which can include loans in deferment, forbearance, or bankruptcy. A lender with 400 loans on the books but only 300 currently accruing interest may pay for 300 loans or 400 loans depending on the vendor’s definition. This distinction matters when comparing quotes.
Per-User-per-Month Pricing
Per-user pricing charges $200-$500 per user per month, typically in tiered packages that include a set number of seats. Entry-level tiers include 3-5 users for $600-$1,500/month. Mid-market tiers include 5-10 users for $1,500-$3,000/month. Enterprise tiers with unlimited users or volume-based discounts are quoted individually and typically start at $3,000/month.
This model is predictable and easy to budget. A lender with a stable team of four loan officers, one controller, and one operations manager pays for six seats regardless of portfolio size. The cost does not increase as the lender adds loans, which makes per-user pricing attractive for lenders with small teams managing large portfolios.
The primary limitation is that per-user pricing does not scale down. A solo lender managing 150 loans still pays for the minimum tier, which is typically 3 users. A two-person shop pays for 3 users or switches to a higher tier if the base tier does not include enough features. Vendors rarely offer single-user plans.
Hybrid Models
Hybrid models combine a base platform fee (usually $200-$500/month) with per-loan or per-user add-ons. A vendor might charge $300/month for the platform and $1 per active loan per month for portfolio tracking. A lender with 200 loans pays $300 + (200 × $1) = $500/month.
Hybrid models are common among vendors who sell unbundled modules: a base loan accounting module, separate add-ons for compliance reporting, borrower portals, and payment processing integrations.
Hybrid pricing is flexible but harder to compare across vendors because the feature bundles differ. One vendor’s base platform may include compliance reporting; another vendor’s may not. A lender evaluating three hybrid-priced platforms must map each vendor’s module structure to their own feature requirements and recalculate the total cost.
What Factors Drive Price Variation Between Vendors?
Two platforms quoting for the same 300-loan portfolio can differ by $1,000/month or more. The largest pricing drivers are integration scope, compliance reporting features, customization requirements, and white-label borrower portals. Vendors price these capabilities differently, and the differences compound.
Integration Scope and API Costs
Standard integrations with QuickBooks, Xero, Salesforce, Stripe, and ACH payment processors are often included in mid-market pricing tiers. Custom API integrations with proprietary accounting systems, alternative credit bureaus, or legacy banking cores are priced separately and typically add $500-$2,000/month per integration. A lender requiring three custom integrations can add $1,500-$6,000/month to their base subscription.
In our work with non-bank lenders, the first pricing audit almost always surfaces undisclosed integration costs. A vendor quoting $1,200/month for the base platform may not include the $800/month required to sync loan data with the lender’s core accounting system. Lenders should list every external system they need to connect and ask vendors to price each integration explicitly.
Compliance Reporting and Audit Features
Compliance reporting modules that generate HMDA, CFPB, state regulatory filings, and audit trails typically add $500-$1,500/month to base pricing. Entry-level platforms aimed at private lenders with no regulatory reporting obligations often exclude these features entirely. Mid-market platforms include basic compliance reporting but charge separately for advanced features like automated HMDA LAR generation or multi-state filing support.
CDFIs and SBA 7(a) lenders require compliance features by definition. A CDFI managing 250 loans must track borrower demographics, loan purpose, and geographic data for annual CDFI Fund reporting. A platform without compliance modules cannot serve this market, regardless of base pricing. The compliance module cost is effectively mandatory for these lenders.
White-Label Borrower Portals
White-label borrower portals allow lenders to brand the borrower-facing login, payment interface, and document library with their own logo, colors, and domain. This feature is standard in mid-market platforms but often priced separately in entry-level platforms. White-labeling adds $200-$800/month depending on customization depth. A lender who wants a fully branded mobile app may pay an additional $1,000-$2,000/month.
Lenders targeting retail borrowers (consumer loans, residential mortgages, small-dollar microloans) treat white-labeling as essential because borrowers interact with the portal frequently. Lenders targeting commercial or real estate borrowers who make quarterly or annual payments often skip white-labeling to save cost.
Customization and Configuration
Custom workflows, non-standard interest accrual methods, and multi-entity structures increase implementation costs and may trigger higher monthly pricing tiers. A lender with one loan product, simple interest accrual, and a single legal entity typically qualifies for standard pricing.
A lender with three loan products, daily compound interest, and a tiered-entity structure (parent holding company, multiple SPVs) requires custom configuration and typically pays 20-40% more in monthly fees.
Some vendors price customization as one-time setup fees; others price it as a higher monthly tier. A vendor charging $1,200/month for standard configuration and $1,800/month for custom configuration is effectively charging $600/month ($7,200/year) for customization in perpetuity. A vendor charging $1,200/month plus a $5,000 one-time setup fee for custom configuration costs less over three years.
How Should Non-Bank Lenders Budget Total Cost of Ownership?
Non-bank lenders managing 100-500 loans should budget $7,500-$45,000 for first-year total cost of ownership and $5,000-$30,000 for recurring annual costs in years two and beyond. First-year costs include licensing, implementation, data migration, training, and support. Year-two costs drop 40-60% because implementation expenses do not recur.
| Lender Profile | Typical Base SaaS (Monthly) | First-Year Total Cost | Year-Two Recurring Cost |
|---|---|---|---|
| 100-200 loans, minimal integrations, no compliance | $400-$800 | $7,500-$15,000 | $5,000-$10,000 |
| 200-400 loans, standard integrations, basic compliance | $1,200-$1,500 | $18,000-$30,000 | $15,000-$20,000 |
| 400-500 loans, custom integrations, full compliance | $2,000-$2,500 | $30,000-$45,000 | $25,000-$35,000 |
A lender with 250 active loans, two loan products, QuickBooks integration, and basic compliance reporting typically falls into the middle row. They pay $1,200-$1,500/month in SaaS fees ($14,400-$18,000/year), $3,000-$5,000 in implementation, $1,000-$2,000 in data migration, and $2,160-$4,500 in annual support fees (15-25% of licensing). First-year total: $20,560-$29,500. Year-two total: $16,560-$22,500.
Lenders should add a 15-20% contingency to their budget for unforeseen costs. The most common budget overruns are additional user seats (a lender budgets for 3 users but needs 5 by month six), custom reporting requests (the vendor’s standard reports do not match the lender’s board reporting format), and integration debugging (an API integration works in testing but fails in production and requires vendor troubleshooting).
Suppose a lender budgets $20,000 for first-year total cost of ownership. They allocate $15,000 for licensing, $3,000 for implementation, and $2,000 for support. Mid-year they add two user seats ($400/month × 6 months = $2,400) and request a custom payment reconciliation report ($1,500).
Their actual first-year spend is $23,900, a 19.5% overrun. A lender who budgets $23,000 with a 15% contingency absorbs the overrun without scrambling for additional funding.
In our work with growing lenders, the most critical budgeting decision is whether to pay for features before they are needed or to start minimal and add modules later. A lender with 120 loans and no regulatory obligations can start at $400-$600/month and upgrade to compliance features when they cross 200 loans or apply for CDFI certification.
A lender planning to apply for CDFI status within 12 months should budget for compliance features from day one, because migrating compliance data retroactively is expensive and error-prone.
FAQs
What is Included in the Base Monthly Fee for a Cloud Loan Management System?
The base monthly fee typically includes loan servicing, payment tracking, borrower communication, basic reporting, and a set number of user seats (3-5 users for entry-level tiers). Most mid-market platforms also include standard integrations with QuickBooks, Xero, and ACH payment processors. Compliance reporting, custom integrations, white-label borrower portals, and API access are often priced separately as add-on modules.
Why Does Implementation Cost So Much, and What Does It Include?
Implementation costs $2,000-$10,000 because it includes workflow configuration, loan product setup, interest accrual method mapping, user role configuration, data migration, and system testing. Data migration alone represents 40-60% of implementation cost when importing from legacy systems or Excel. High-complexity setups with custom workflows or multi-entity structures require 30-50 hours of vendor labor, which is priced at $100-$200/hour.
Are There Free or Low-Cost Loan Management Software Options for Small Lenders?
Free loan management software does not exist for portfolio-scale servicing. Open-source accounting platforms like GnuCash or free spreadsheet templates can track 10-20 loans manually but lack automated payment processing, compliance reporting, and borrower portals. The lowest-cost commercial options start at $400/month and are designed for lenders with 50-200 loans and minimal integration requirements.
Solo lenders managing fewer than 50 loans often use Excel until they cross the threshold where manual tracking becomes unmanageable.
Do I Pay More If I Add More Loans to My Portfolio Mid-Year?
Yes, if your vendor uses per-loan pricing. Most per-loan vendors tier their rates by volume (e.g., $3/loan/month for 0-200 loans; $2/loan/month for 201-500 loans). Crossing a volume threshold triggers the new rate, which applies to all loans, not just incremental ones. If your vendor uses per-user pricing, adding loans does not increase your monthly cost unless you add team members.
What is the Difference Between Cloud SaaS and On-Premise Loan Management Software Pricing?
Cloud SaaS pricing charges $400-$2,000/month in subscription fees with no upfront licensing cost. On-premise software charges $10,000-$100,000 in perpetual licensing fees plus $50,000-$200,000 in server hardware, database licenses, and IT implementation costs. On-premise total cost of ownership over three years is 3-5x higher than SaaS for lenders with 100-500 loans. SaaS is the dominant model for non-bank lenders because it eliminates infrastructure management.
How Much Do Add-Ons Like Compliance Reporting or API Integrations Cost?
Compliance reporting modules add $500-$1,500/month. Custom API integrations add $500-$2,000/month per integration. White-label borrower portals add $200-$800/month. Multi-entity support and advanced reporting dashboards add $300-$1,000/month. Collectively, add-ons can double the base monthly subscription cost. A lender paying $1,200/month for the base platform and $1,800/month in add-ons pays $3,000/month total ($36,000/year).
What is the Typical Payback Period or ROI for a Loan Management Platform?
Payback period is 6-18 months depending on the labor cost saved. A lender spending 20 hours/week on manual loan accounting, payment tracking, and borrower communication at $50/hour loaded cost saves $52,000/year in labor. If the platform costs $20,000/year, payback is 4.6 months.
Lenders with smaller portfolios or lower labor costs see payback in 12-18 months. ROI calculation should include reduced error rates and faster portfolio growth enabled by automation.
Are There Any Long-Term Contracts or Early Termination Penalties?
Most cloud LMS vendors offer month-to-month subscriptions with no long-term contract, but some require 12-month commitments for mid-market and enterprise tiers. Early termination penalties range $1,000-$5,000 if a lender cancels before the contract term ends. Vendors who bundle implementation costs into the monthly subscription often require 24-36 month contracts to amortize setup costs. Lenders should negotiate contract length and termination terms before signing.